The most versatile and complete software for STEM Education
Coach integrates the following tools:
- Data Logging
- Control
- Data Video
- Spectrometer
- Modeling
- Animations
- Data Processing
- Authoring
- Teaching Resources
Coach Your Students Into The World Of Science
Data Logging (starting from version 7.2 also in Coach 7 App for tablets)
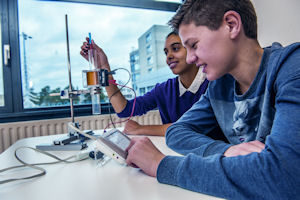
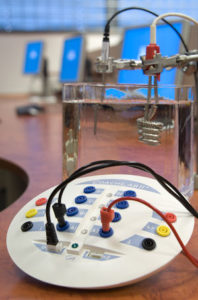
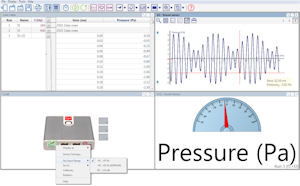
An interface equipped with a selection of sensors is a universal measurement instrument and can be used in many experiments. The Coach Measurement Activities enable you to measure and record data over a period of time via an interface and sensors. The rate of data collection is available over a wide range of time-periods and frequencies. Different measurement methods: time-based (with- and without triggering), event-based, manual (with- and without sensors) allow performing a wide range of experiments. Real-time presenting data while being collected makes data collection an interactive process whereby direct observations may be immediately compared with the graph, encouraging thinking about the data.
Control (not supported in Coach 7 App for Tablet)
The unique combination of measuring and control allows controlling processes, to automate measurements and to study the behavior of systems. The Coach Control Activities enable you to use and create control programs. The environment offers several modes of programming.
Data Video
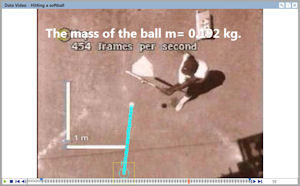
Brings real world into your classroom and allows analyzing attractive events and “difficult” experiments that are impossible to perform in the classroom. The Coach Data Video Activities enable you to make measurements on digital video clips (manually by clicking or automatically by tracking the selected object) or still images, and to analyze motion or shapes of real objects. To bridge the gap between the visual display of a motion and its abstract graphical representation the graphs are synchronized with the video frames.
Students can capture their own videos with the help of camera or mobile phones. They also can use affordable high-speed cameras to capture very fast motions and to analyze these motions in details.
Additionally Coach offers many extra features like capturing and editing a video or correcting a perspective distortion.
Modeling
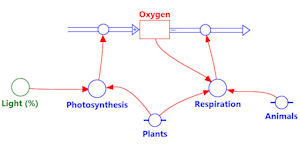
Helps students to understand the world of computational models; such models are used today in every area of research and industry. The Coach Modeling Activities enable you to use ready-to-go models or to create models of dynamic changing systems. In such models the evolution of a system is computed step by step. Modeling allows solving realistic problems that are difficult to solve analytically at the school level. It encourages students to think, to discuss their ideas and to clarify their understandings. The data generated by model can be compared with experimental data and the model can be modified to match the real experiment.
Spectrometer (not supported in Coach 7 App for Tablet)
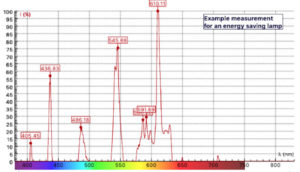
Starting from Coach 7.4 a new type of Activity – Spectrometer is added. This type of Activity allows to work with CMA Spectrometer and to record Emission and Absorption spectra over a range of 360 – 940 nm.
Animations (not supported in Coach 7 App for Tablet)
Help students to better understand the meaning of data. Presenting data in a table or graph may not be enough for students to fully understand the underlying principles of a phenomenon. Animation is another way of representing the data. The Coach Animations consist of animated graphics objects, like ellipses, rectangles, vectors or images, which can be linked to model variables, program variables or sensor values to control their screen movement. Additionally interactive control objects, like buttons and sliders, allow altering parameter variables during the execution of the animation to interact with the system and to see the effect of those changes.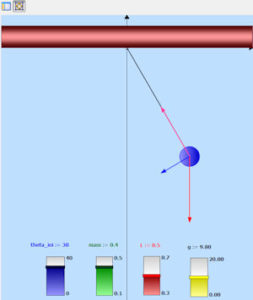
Data Processing
Data collected from sensors, video clips, or generated by models, can be displayed as digital values, on meters and graphs. They can be further processed with the help of:
- analysis tools: zooming, reading values, finding a slope, finding an area under a graph,
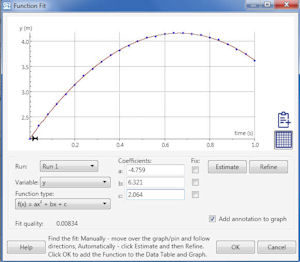
- processing tools: selecting and removing data, smoothing a graph, calculating new variables by using mathematical functions, function fit, calculating a frequency spectrum,
- statistical tools: finding statistical data information, creating a histogram.
Authoring – Build your own activities
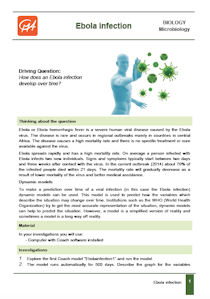
The program includes step-by-step tutorials and ready-to-go activities. But Coach also enables you to build your own activities filled with exciting learning content. Create your own custom activities with the tool you need, for the desired student level, with your texts, images, videos, student questions, and with a layout that displays the way you want it.
Teaching Resources
You do not have to spend money on books!
Following innovative educational ideas CMA developed teaching resources for use at different school levels. Our activities are authentic, inquiry-based and facilitate active learning by students. Students work like a scientist and collect high-quality, real data, construct and use computer models, compare results from experiments and models.
- All our teaching resources can be found at our website under Teaching Resources.
- The Primary Science resources, Student worksheets and Teacher guides, are completely free to download.
- The resources for Middle, High and College level, are free for our Coach 7 Users. Simple register with your Coach 7 License Code. Then login and freely browse and download the activities.
