Position
 101010In this activity students record motion graphs. They are asked to walk in front of the Motion detector and a graph of distance vs. time is being plotted real-time on the computer or data-logger screen during their motion. Students are asked to interpret resulting graphs.
Activity Graphing distance (demo)
101010In this activity students record motion graphs. They are asked to walk in front of the Motion detector and a graph of distance vs. time is being plotted real-time on the computer or data-logger screen during their motion. Students are asked to interpret resulting graphs.
Activity Graphing distance (demo)
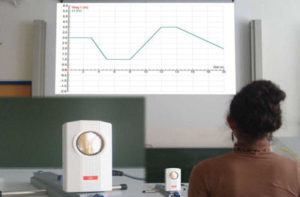 In this activity students walk in front of the motion detector to match the given distance vs. time graph
Activity Match the graph (demo)
In this activity students walk in front of the motion detector to match the given distance vs. time graph
Activity Match the graph (demo)